Carnegie Mellon Racing · Driverless Controls
Regen Braking Dynamics Modelling
Our drivers said they could feel regen slowing the car. I needed that in numbers, so I fitted a braking model to a season of vehicle logs. The answer came with a caveat I did not expect: in this dataset, regen and the brake pedal are 95% collinear, so the honest result is a range, not a number.
Analysis complete · More data needed
Oct 2026 · Pittsburgh, PA · Regenerative Braking Lead
Python · NumPy · SciPy · pandas · asammdf · Matplotlib
This is the second half of the regenerative braking project. The first half was designing the control strategies. This half is about measuring what regen actually does to the car, using the data that testing produced. Everything below describes the parallel strategy, which is what the car was running.
The team wants to shrink the pneumatic brakes on the next car and let regen take over part of the job. That is not a decision you can make on feel. It needs a number: how much deceleration do we get per newton-metre of regen torque we ask for? Everything below is an attempt to answer that honestly, including the part where the data refuses to answer it cleanly.
01 · Experiment design · Working with data you did not plan
Isolating Regen From Friction Braking
The Problem
On the car today, regen runs in parallel with the friction brakes: press the brake pedal and some regen torque comes in alongside the hydraulics. That is good for the driver and terrible for measurement. Every regen event is also a braking event, so the two effects arrive together and the log cannot tell you which one slowed the car.
I could not re-run the season with a cleaner experiment. I had a pile of logs from testing days that were run for other reasons.
A Two-Stage Model
The way around it is to learn the brakes first, from data where regen is definitely absent, then treat regen as whatever is left over.
Stage one fits deceleration against brake pressure using only braking events with regen switched off. Motor torque is zero by construction in those events, so the fit needs no torque or current signal at all, which matters because the current channels are the least trustworthy ones in the log.
Stage two applies that model out of sample to braking events with regen switched on. Whatever deceleration the brake model fails to explain is the regen contribution.
Two sessions made this possible: in both, the driver toggled between a gear with regen and a gear without it within the same session, 42/58 and 62/38 by time. Same brakes, same driver, same track, same pad temperature. That is as close to a controlled A/B as a race team’s testing day gets.
Statistical Methodology
Events, not samples. My first fits treated every 10 ms sample as an independent observation, which is not true: samples inside one brake application are nearly identical. Refitting on one row per braking event widened the confidence interval on brake authority from [14.0, 14.3] to [12.5, 15.2]. The old intervals were roughly ten times too narrow. Nothing about the central estimate changed; what changed was how much I was entitled to claim.
Robust regression, not least squares. I ran a null test: fit the regen coefficient on data where regen is off, where the true answer is zero. Ordinary least squares returned +0.0239, pulled by outliers. Huber regression returned −0.0001. I used Huber everywhere after that.
Result
364 braking events across a 35-log testing day, each one row: duration, brake pressure, speed, deceleration, and commanded regen torque.
02 · Stage one · Brake authority
Physical Validation of the Brake Model
The Fit
The brake model is deliberately boring:
decel = 0.01343 · bps + 0.0448 · v + 0.789
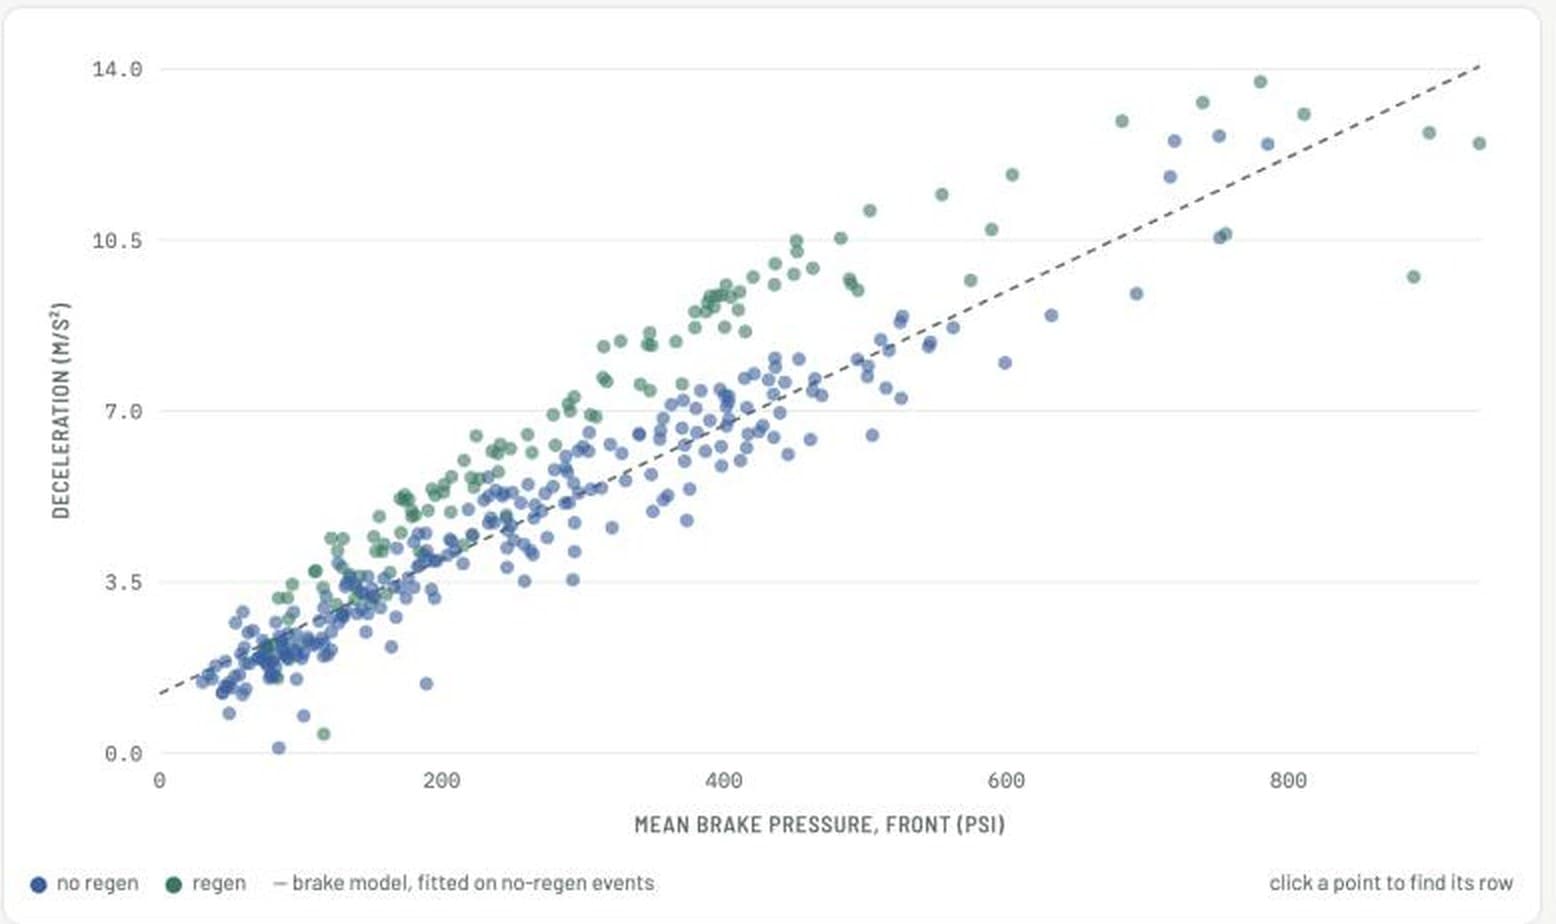
with brake pressure in psi and speed in m/s. That is 13.43 m/s² per 1000 psi, 95% CI [12.36, 14.51], with a held-out R² of 0.934 on events the fit never saw.
Linearity in Brake Pressure
A good R² is not evidence that a model is right, so I checked the shape against the hydraulics. Caliper clamp force is pressure times piston area; pad friction is a coefficient times clamp force; brake torque is that times an effective radius. Chain it together:
decel = (2 μ A r_eff) / (R_wheel · m) × P
Linear in pressure, provided the pad friction coefficient is constant. So I tested for curvature by adding a squared pressure term: its coefficient came out at −8.1 × 10⁻⁷ with a 95% CI of [−9.2 × 10⁻⁶, +2.4 × 10⁻⁶], which contains zero. No measurable curvature between 30 and 785 psi.
The Empirical Speed Term
The linear speed term is an empirical convenience and I want to be clear about that. Real road load is a constant rolling term plus a v² aerodynamic term, with no linear term in it. Adding terms in order: brake pressure alone gives R² 0.9349, adding v² gives 0.9371, adding a pedal deadband gives 0.9372. Brake pressure explains 93.5% of the variance and everything else contributes 0.2%.
The constant, 0.789 m/s², is also not drag. Real road load for this car at 15 m/s is roughly 0.3 to 0.8 m/s², so the intercept is absorbing pad deadband and whatever else is systematic. It should not be quoted as an aerodynamic measurement.
One more limitation worth stating: there is no grip ceiling in this model. Above some deceleration the tires, not the pressure, set the limit, so the true relationship has to bend over. The hardest events in the data cluster around 12.5 m/s² at roughly 750 psi, which looks like that ceiling, but there are only six of them.
03 · Stage two · The number the ticket asked for
Regen Torque as Model Residual
The Result
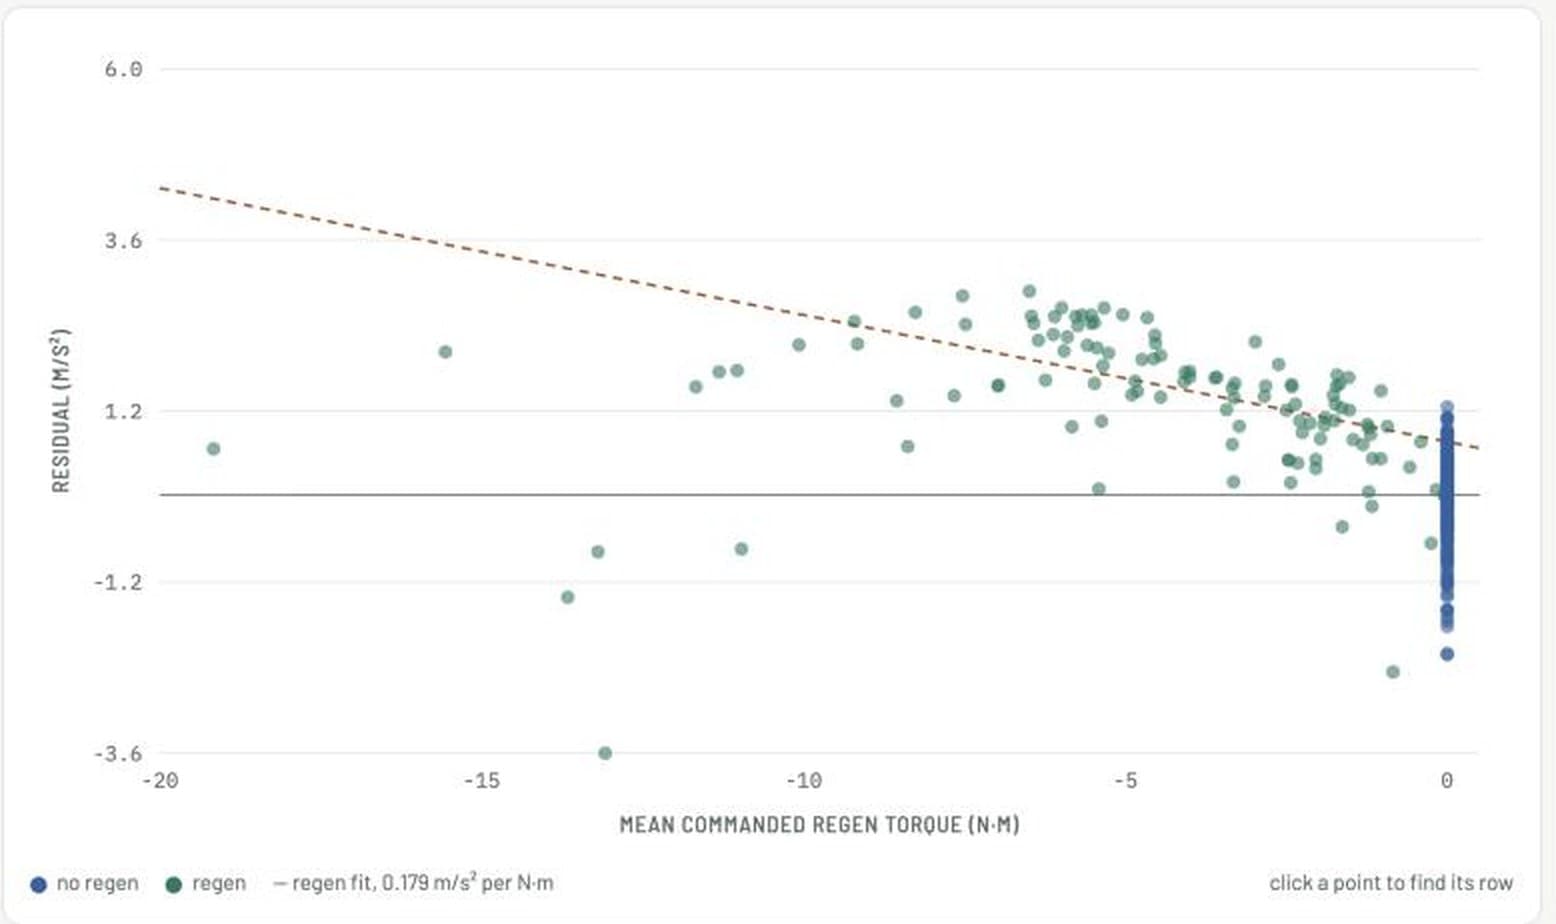
Applying the brake model out of sample to regen-on events and regressing the residual against commanded regen torque:
0.179 (m/s²)/N·m, 95% CI [0.104, 0.306]
≈ 5.6 N·m of regen per 1 m/s² of deceleration
Across the whole day, regen supplied roughly 12% of total braking on average and 18% at the 90th percentile, with the strongest single event reaching 0.39 g.
Physical Cross-Check
There is an independent way to check that slope. The torque needed per unit of deceleration is set by gear ratio, wheel radius and mass, so inverting the measured slope gives an implied vehicle mass. Theory says 0.198 (m/s²)/N·m for a 300 kg car.
The fit returned 0.1989, implying 299 kg. The car is about 300 kg. Across every independent route I tried, implied mass landed between 230 and 364 kg, clustering around 300. That is not a tight confirmation, but it does mean the number is physically plausible rather than a curve fit that happens to minimise error.
04 · The negative result
Collinearity and Estimate Sensitivity
Sensitivity Across Data Streams
The obvious question is which deceleration signal I used, so I reran the whole pipeline on four of them: the longitudinal accelerometer, its pitch-corrected version, and the derivative of two different speed channels.
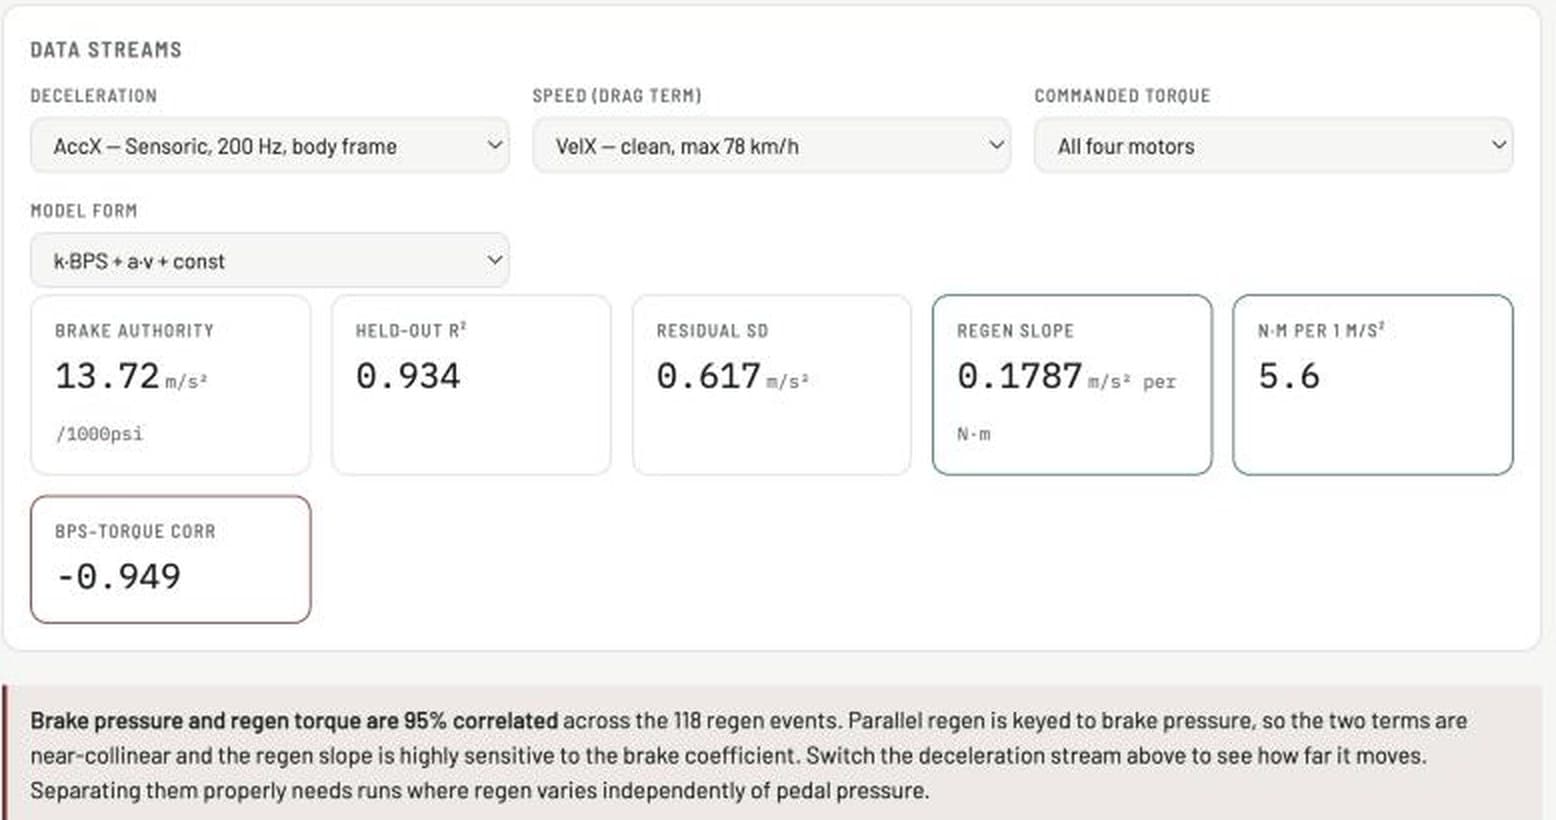
The streams agree with each other. Event-by-event correlation is 0.95, the median difference between them is 0.00 m/s², and brake authority barely moves: 13.72, 13.31, 14.00, 14.52. But the regen slope moved by a factor of four to five across the same four streams.
The Cause
The correlation between brake pressure and commanded regen torque in this dataset is −0.949. That is not an accident of sampling. Parallel regen is keyed to the brake pedal by design, so the harder you brake, the more regen you get: 20 to 150 psi gives about −1.13 N·m, and above 700 psi gives about −13.28 N·m. The two effects are 95% collinear by construction.
That has a sharp consequence. A 4% change in the fitted brake authority, well inside its confidence interval, moves the regen slope by 28%: nudging brake authority from 13.16 to 14.25 swings regen from 0.193 to 0.139. The brake number is solid and the regen number is riding on top of it.
So the defensible statement is a range, 5 to 7 N·m per 1 m/s², and the honest conclusion is that brake and regen effects are not separable in this dataset. The fix is not more analysis. It is a change to how we test: vary regen independently of brake pressure, or run a coast-down A/B.
05 · Cross-validation · Driverless data
Cross-Validation With Driverless Data
Why Driverless Data Decouples the Terms
Then I realised the clean experiment already existed. In driverless, the car has no mechanical braking at all. Every bit of deceleration under a negative torque command is regen, with brake pressure at essentially zero. The two-stage model collapses to a single line:
decel = k · torque + drag
The Result
Hunting through a driverless testing day produced nine genuine pure-regen events, brakes reading 0.2 to 2.7 psi, all at 21 to 24 km/h:
k = 0.193 (m/s²)/N·m → 5.2 N·m per 1 m/s² → implied mass 308 kg
Theory for a 280 kg car predicts 0.213. And 0.193 sits inside the parallel-regen confidence interval of [0.104, 0.306]. Two control paths, two testing days, two entirely different methods, landing on the same number.
It survived the checks I could throw at it: stable across resample rates from 25 to 200 Hz (0.187 to 0.201), leave-one-out gives 310 to 320 kg for eight of the nine events, and dropping the two highest-leverage points leaves k at 0.192.
The honest limitation is that all nine events sit in a 3 km/h band, so drag and the intercept cannot be separated. The next data I need is regen at a range of speeds, and that is what I asked the team for.
Why the Path Planning Work Feeds This One
That request has a dependency, and it is my other project. Every driverless lap is a pure-regen dataset by construction, so the way to get regen events across a range of speeds is simply to run the car driverless more, and over more varied ground. Skidpad holds a constant radius at a near-constant speed, which is why these nine events are packed into 3 km/h. Autocross has corners of every radius, straights to brake from, and therefore braking events spread across the speed range.
The car only runs driverless autocross if the path planner can be trusted on a track it has never seen, at speed, without handing the controller a corridor that does not exist. That is exactly what the Delaunay edge selection work is for. Making the planner robust is what unlocks the dataset this model needs, which is a connection I did not expect when I picked up the second project.
Conclusions
Brake authority is settled: 13.43 m/s² per 1000 psi, with a held-out R² of 0.934 and a shape that matches the hydraulics.
Regen is 5 to 7 N·m per m/s², with two independent methods agreeing inside that range, which is enough to size a parallel-regen strategy but not enough to tune one precisely.
Closing the gap needs testing, not more fitting: regen varied independently of brake pressure, and regen events across a range of speeds rather than all at 22 km/h.